The Knowledge Graph Behind Every Story
Tap any underlined company or technology and a sidecar opens with what it is, what it connects to, and how its search signal is moving — without leaving the paragraph.
The short answer
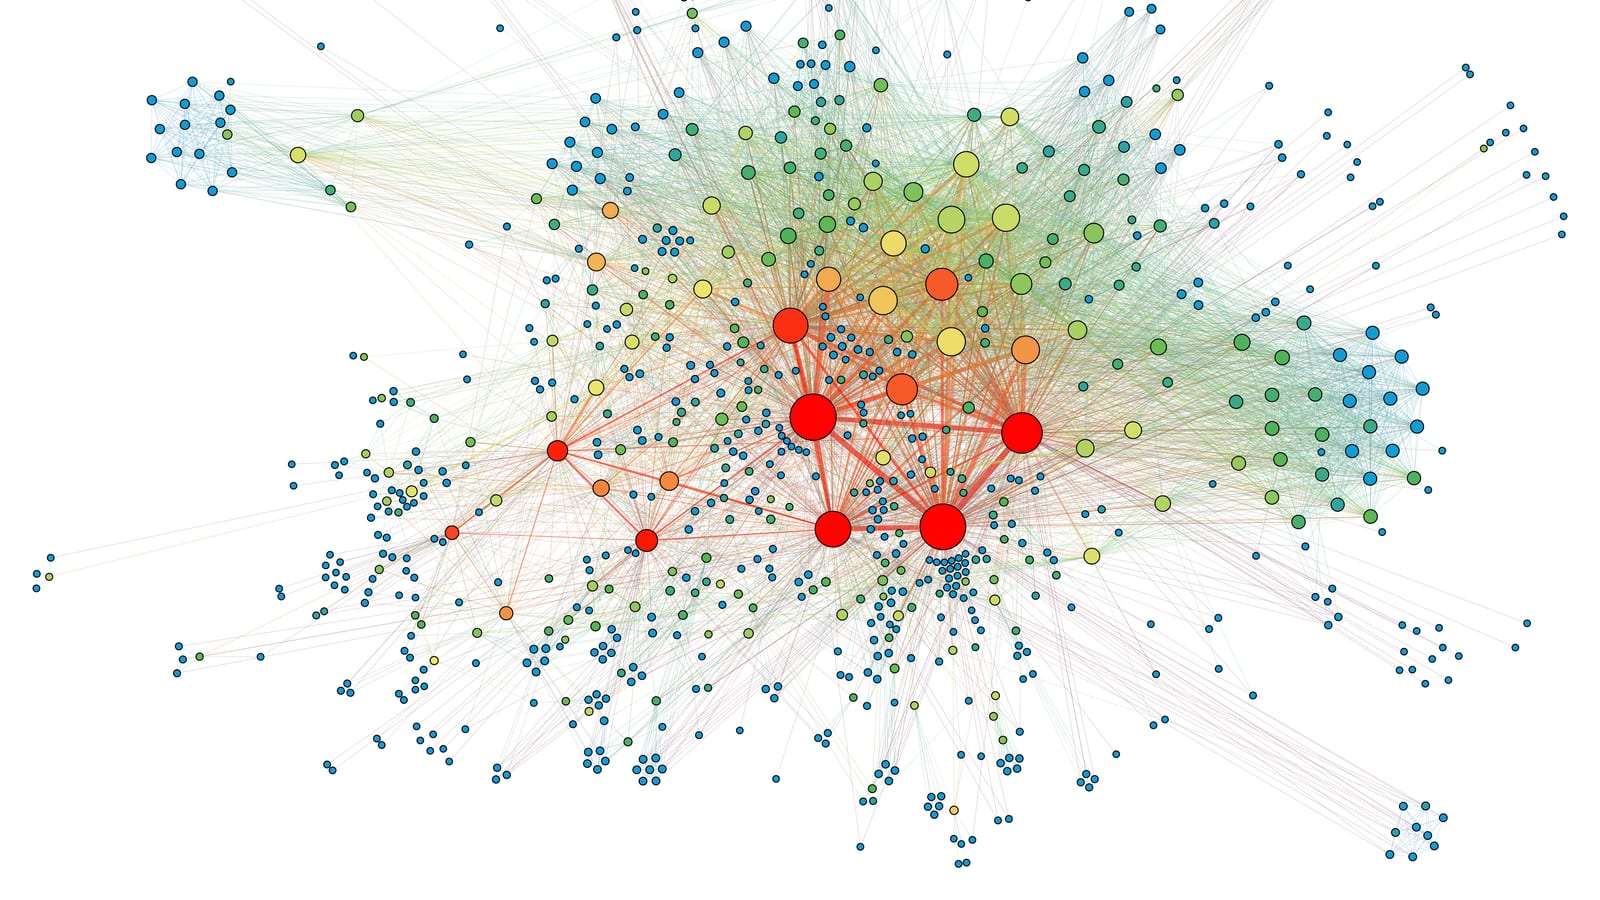
Every GPT AUTOBLOG article marks the first mention of known entities and opens a knowledge-graph sidecar on tap — description, related entities, sourced timeline events and a live trend line when a real signal exists — with extraction done server-side so it is instant and never fabricates data.
Most articles assume you already know who the players are. The ones that do not stop to explain, and the explanation is where you lose the thread. We wanted a third option: the explanation is there, exactly where you need it, and only if you ask.
On GPT AUTOBLOG the first mention of a known entity — , , , — carries a faint underline and a small arrow. It is not a blue link; it does not take you anywhere. Tap it and a sidecar slides in from the right with a short description, the entities it relates to, and, where a real signal exists, the live trend line for that topic.
The graph itself is small and curated on purpose. Every entity was added by hand with its aliases, its type and its relationships, and the extraction that finds them in an article runs on the server before the page reaches you. That is why the underline is already there when the page loads, and why the sidecar opens instantly — there is no round trip to decide what an entity is.
From inside the sidecar you can move: to a related entity, to a timeline of dated events we can source, or you can follow the entity so its movement surfaces on your Following page. The article stays put underneath. Close the panel and you are exactly where you left off.
A word on what the graph refuses to do. It shows a metric only when it is linked to a real trend signal; it never invents a number to fill a card. Timeline events appear only above a confidence threshold, with a source. Where we do not know, the panel simply has less in it.
The effect, after a few articles, is that the site starts to feel less like a stack of pages and more like a map. The stories are the roads; the entities are the towns; and you can always see how the town you are standing in connects to the rest.
The story so far
Key takeaways
- 01Entity marks are subtle underlines, not links; the article never navigates away.
- 02Extraction runs server-side; the sidecar opens with no round trip.
- 03Metrics and timeline events appear only when real, sourced data exists.
Frequently asked
How are entities chosen?
+
They are curated by hand with aliases, type and relationships, then matched server-side on first mention in each article.
Where do the trend numbers in the sidecar come from?
+
From real trend signals linked to that entity. If no signal is linked, no metric is shown.
Can I follow an entity?
+
Yes. Follow from the sidecar and it appears on your Following page with what's new for it.
Ask this article
Sources
- Internal opportunity model · confidence 0.87
- Search Console impressions, trailing 30 days
- First-party trend telemetry, gptautoblog.com
Related Intelligence

Ask the Article: Answers Cited to the Paragraph

Every Article Now Has a Voice

Pulse: Call the Trend Before It Peaks
Continue exploring